Distribution and trends
Distribution

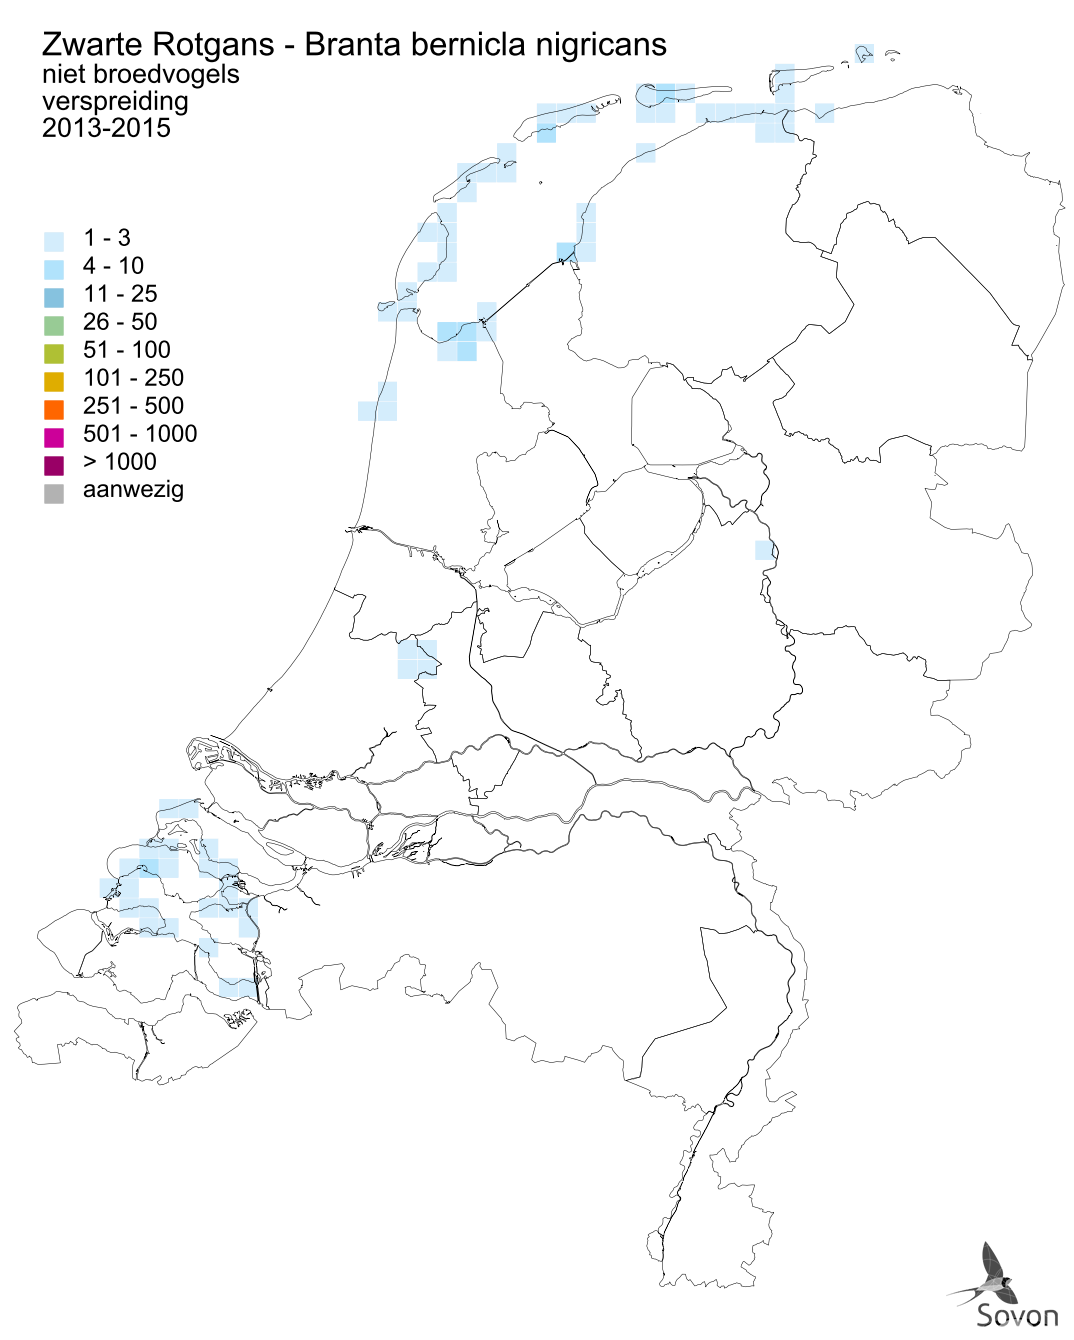
This map is derived from the Bird Atlas of the Netherlands (Sovon 2018). For each atlas square of 5x5 km, an estimate for the number of wintering birds is given.
Population trends
waterbird trend
The data comes from the Waterbird Monitoring Network. For each season, the average number of birds (red dots), the trend line (dark blue) and associated standard error (light blue lines) are given. Seasons run from July to June.
- vanaf 1980
- significant increase, >5% a year (++)
- laatste 12 jaar
- no detectable trend (~)
Breeding success and survival
Not enough data.
Seasonal occurrence
seasonal pattern
Data derived from waterbird monitoring scheme (mostly monthly counts during winter). Shown is the monthly average number of birds for for the last five seasons. For each month is indicated which part is counted and what part is estimated (calculated using statistical methods). The red line shows the multi-year mean. This is the average over all months of the season, from July to June of the last five seasons. Months without estimation (indicated by ?) it is assumed that there were no birds.
Occurrence description
Buiten broedtijd
Na de eerste waarneming in 1974 werden jaarlijks Zwarte Rotganzen in Nederland gezien. Het gaat doorgaans om maximaal een tiental – meestal volwassen - vogels per winter die zich vrijwel per definitie ophouden in groepen Rotganzen. De verspreiding valt daarom samen met die van de Rotgans, met een duidelijk accent op het Wadden- en Deltagebied. Waarnemingen werden tot en met 1998 beoordeeld door de Commissie Dwaalgasten Nederlandse Avifauna.
Birds directive
Conservation status
No conservation status of this species is available.
Assigned areas
No areas assigned
Counting guidelines
No counting guidelines available.
