Distribution and trends
Distribution

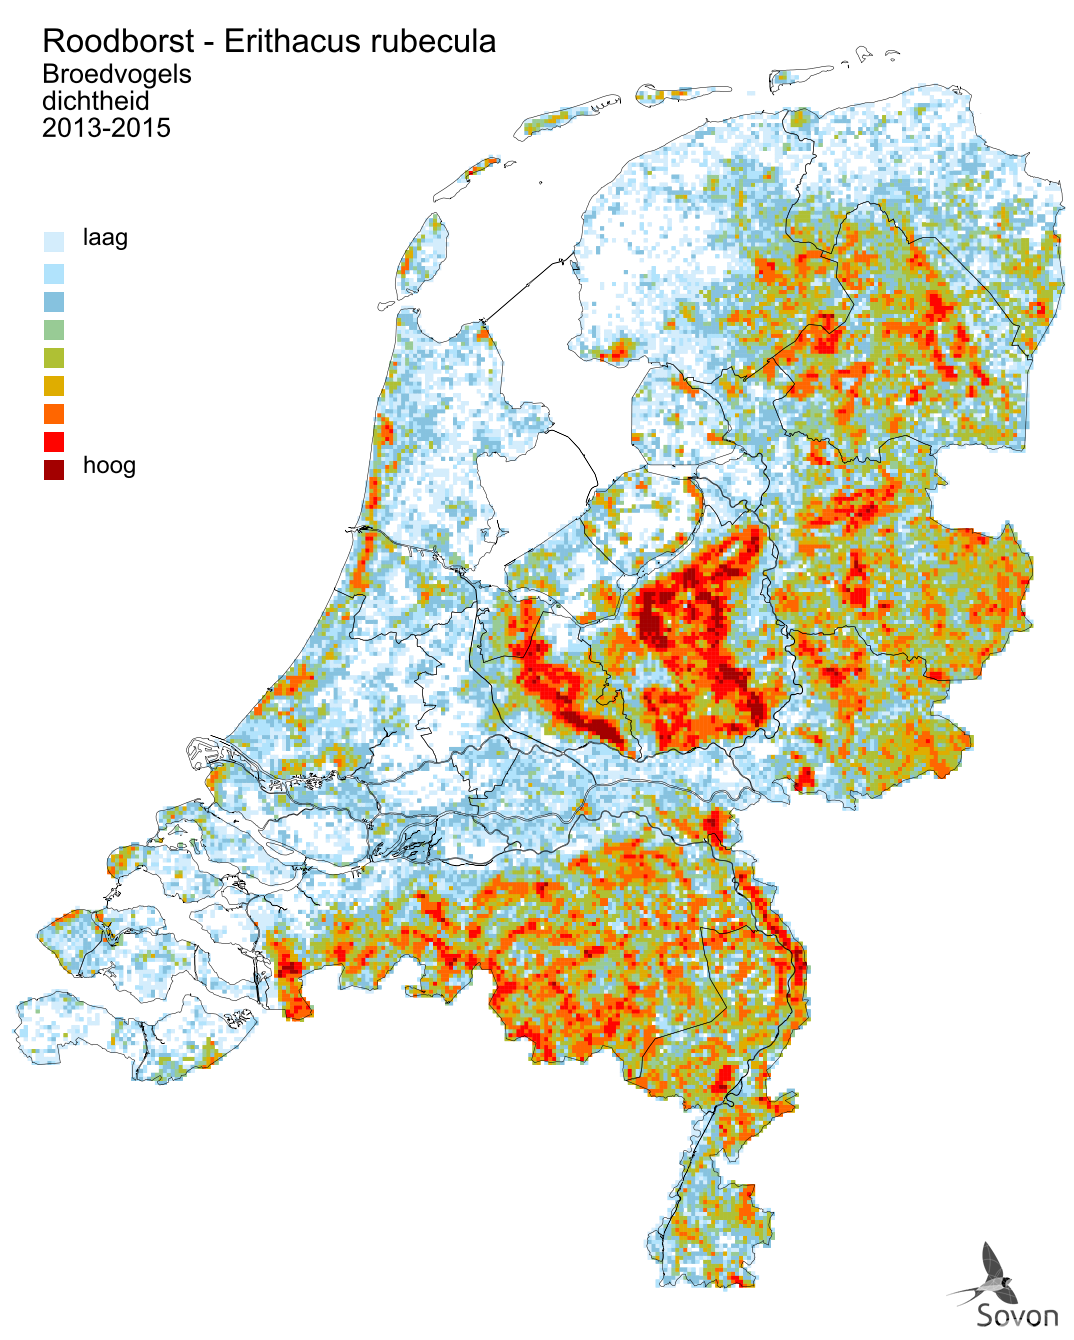
This map is derived from the Bird Atlas of the Netherlands (Sovon 2018). Shown is the relative density of breeding pairs per square kilometer.

This map is derived from the Bird Atlas of the Netherlands (Sovon 2018). Shown is the relative density of wintering birds per square kilometer.
Population trends
breeding bird trend
Data derived from the common breeding bird census. Shown are annual population indices, derived from national surveys of sample plots (red dots) and the trendline (dark line). Data from 1984-1989 can be less reliable.
- vanaf 1990
- significant increase, < 5% a year (+)
- laatste 12 jaar
- significant increase, < 5% a year (+)
non-breeding bird trend
Data derived from point-transect-counts in december. Shown is the annual population index (with standard error), calculated over about 500 transects with each 20 point-counts.
- vanaf 1980
- significant increase, < 5% a year (+)
- laatste 12 jaar
- significant decrease, <5% a year (-)
Breeding success and survival
adult survival
This graph is based on the Constant Effort Site project (CES). It shows the annual local survival of adult birds (with 95% confidence interval).
nesting success
This graph is based on the Nest Record Scheme. The average percentage of successful nests (with 95% confidence interval) is shown.
Seasonal occurrence
seasonal pattern
This chart is based on LiveAtlas. The reporting frequency per decade is shown, averaged over the last 5 years. The reporting frequency is the percentage of complete lists on which the species is registered.
laying start
This graph is based on the Nest Record Scheme. The average annual date of laying of the first egg is shown (with 95% confidence interval).
Occurrence description
Buiten broedtijd
De Nederlandse broedvogels trekken deels weg richting Zuidwest-Europa. De achterblijvers krijgen aanvulling door vogels uit Noordoost- en Oost-Europa, waarvan een deel in ons land overwintert en een deel doortrekt. De najaarstrek vindt vooral plaats tussen half september en eind oktober. In dezelfde periode herleeft ook de zangactiviteit. De voorjaarstrek is onopvallend. De wintervogels zijn gewoonlijk in de loop van maart of april verdwenen.
Broedtijd
Roodborsten ontbreken alleen in boomarme landschappen. De dichtheden zijn het hoogst in bossen met een goed ontwikkelde struik- en kruidlaag. In dennenbossen met weinig ondergroei zijn de dichtheden veel lager, net als in agrarisch cultuurland en dichtbebouwd stedelijk gebied. De soort breidde zich sinds ongeveer 1975 uit in het westen en noorden van het land dankzij aanplant van bosjes in voorheen zeer open landschappen. De landelijke aantallen blijven, met de nodig schommelingen, groeien. Ze vertonen inzinkingen na strenge winters zoals midden jaren tachtig en negentig. Hiervan herstelt de populatie vlot.
Birds directive
Conservation status
The Birds Directive focuses on the conservation of all naturally occurring wild bird species in Europe, including the European Robin.
This means that EU Member States must take measures to maintain or bring the populations of these species to a level that corresponds in particular to ecological, scientific and cultural requirements.
The Birds Directive requires Member States to maintain habitats for birds of sufficient size and quality, including through the designation of Special Protection Areas for the benefit of the European Natura 2000 network. No special protection zones have been designated for the European Robin in the Netherlands. The national population must be able to maintain itself at a favorable level.
What is the methodology to assess the conservation status of birds
breeding bird
The conservation status of the European Robin as breeding bird in the Netherlands is favourable.
| State of Conservation Assessment | ||||
| Distribution | Population | Habitat | Future | Final verdict |
| favourable | favourable | favourable | favourable | favourable |
non-breeding bird
The conservation status of the European Robin as non-breeding bird in the Netherlands is favourable.
| State of Conservation Assessment | ||||
| Distribution | Population | Habitat | Future | Final verdict |
| favourable | favourable | favourable | favourable | favourable |
Assigned areas
No areas assigned
Counting guidelines
Broedvogels
Methode
Territoriumkartering
Tijd van het jaar
Begin March t/m eind June
Tijd van de dag
Vooral in de vroege ochtend (rond zonsopkomst) en late avond (zonsondergang).
Datumgrenzen, normbezoeken en fusieafstand
| Valid sightings | normbezoeken | minimaal vereist | fusie- | |||||||||
| adult | paar | terr | nest | migrant | 1 | 2 | 3 | seizoen | datumg | datumgrens | afstand | |
| . | . | X | X | 1-9 | 10-13 | 14+ | 1 | 20-4 t/m 25-6 | 200 | |||
Aanwijzingen
Zang [broedcode 2] (sterk gepiekt voorafgaand aan beide broedsels) en aanwijzingen voor nest: nestbouw [brc 9], alarm [brc 7] (let ook op alerte vogel die waarnemer voortdurend in de gaten houdt), transport van voedsel [brc 14] (mannetje voert broedend vrouwtje, beide partners voeren jongen) en ontlastingspakketjes [brc 14] (beide partners).
LET OP: dichtheden kunnen in rijke bossen en andere optimale habitats hoog zijn. Massale zang 's ochtends vroeg levert veel 'uitsluitende waarnemingen' op, maar kan deels overstemd worden door andere vogelsoorten (lijsters); telling 's avonds tijdens zangpieken (vooral eind mei/half juni) kan goed alternatief zijn. Broedende vrouwtjes verlaten nest met bedelgeluidjes ('sit-sit-sit') om te worden gevoerd door mannetje; vliegen daarna onmiddellijk terug naar nest. Het geluid, eenmaal ervaren, is onmiskenbaar en een duidelijk nestindicatieve waarneming [brc 7].
Broedbiologie
Broedt in allerlei boomrijke landschappen, inclusief stedelijk gebied. Twee broedsels per jaar, meestal 5-7 eieren, broedduur 12-15 dagen, nestjongenperiode 13-15 dagen, uitgevlogen jongen worden nog 2-3 weken verzorgd.
