Distribution and trends
Distribution

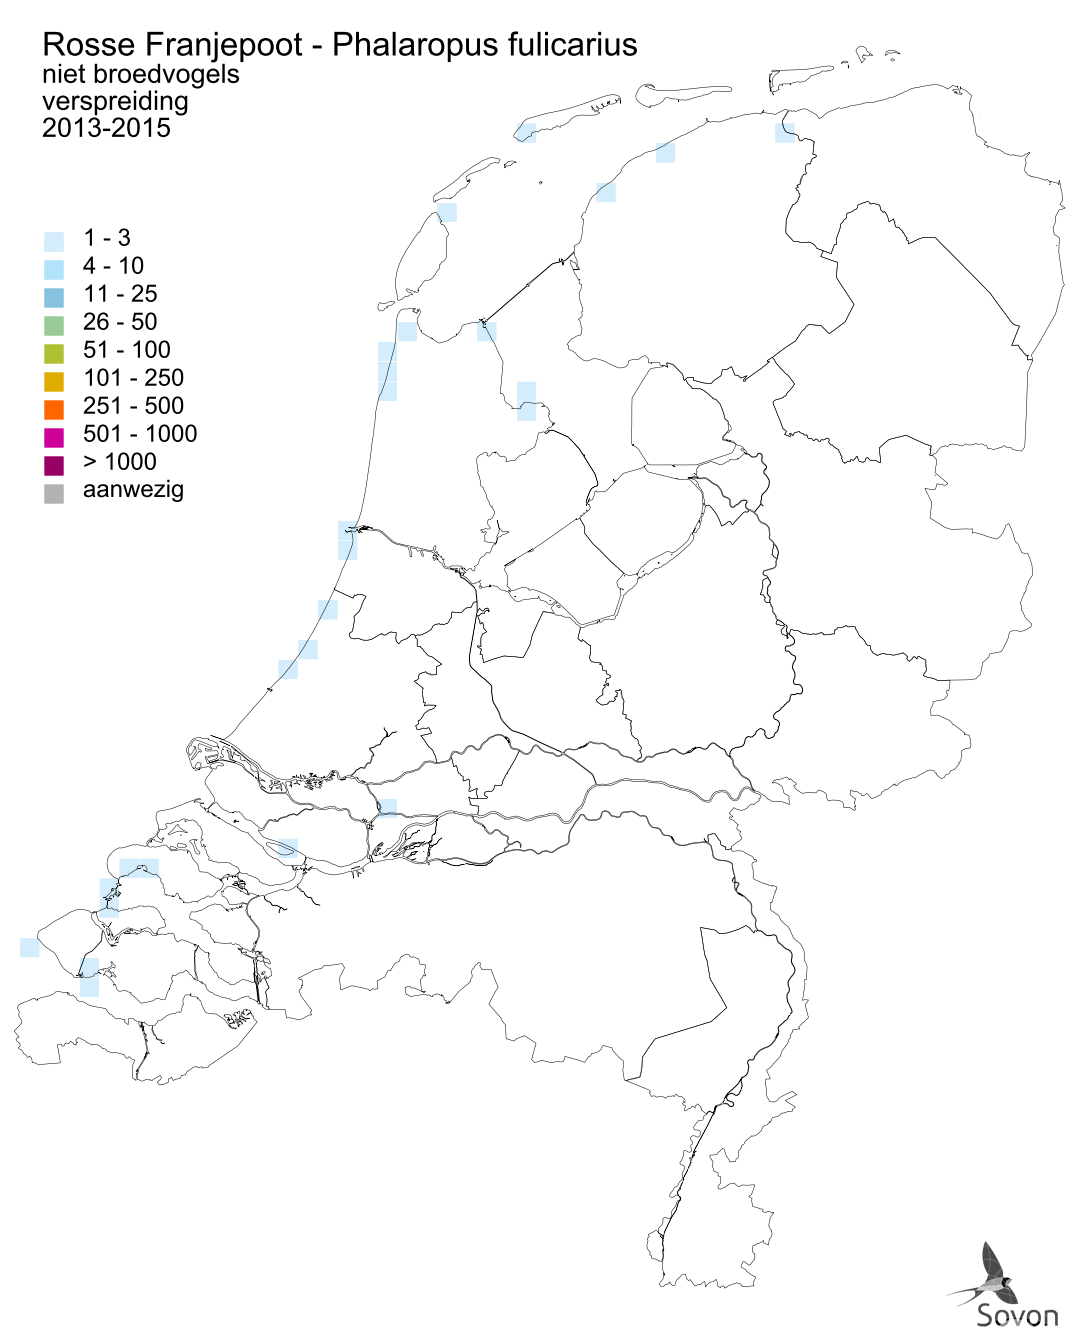
This map is derived from the Bird Atlas of the Netherlands (Sovon 2018). For each atlas square of 5x5 km, an estimate for the number of wintering birds is given.
Population trends
seabird trend
Data derived from systematic counts of migrating individuals. For each season, the hourly average number of birds (red dots), the trend line (dark blue) and associated standard error (light blue lines) are given. Seasons run from July to June.
- vanaf 1988
- significant increase, < 5% a year (+)
- laatste 12 jaar
- no significant change in numbers (0)
Breeding success and survival
Not enough data.
Seasonal occurrence
seasonal pattern
Data derived from systematic counts of migrating individuals. Shown is the monthly average number of birds for for the last five seasons. For each month is indicated which part is counted flying to the left or to the right.
Occurrence description
Buiten broedtijd
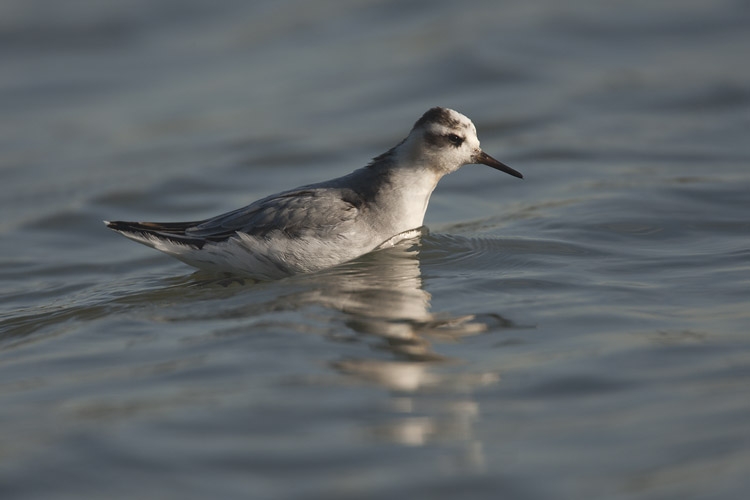
Rosse Franjepoten bij ons zijn afkomstig uit een gebied van Groenland tot Spitsbergen. Bijna alle waarnemingen stammen uit de maanden september-februari, vooral de periode tussen eind september en half november. De soort is sterk kustgebonden; trekkers zijn langs de hele kustlijn schaars waarneembaar. Ze zoeken soms plasjes op het strand op maar foerageren meest op zee, zowel direct achter de branding als op luwe plekken zoals in havens. In het binnenland is de Rosse Franjepoot nog zeldzamer dan de Grauwe Franjepoot.
Birds directive
Conservation status
No conservation status of this species is available.
Assigned areas
No areas assigned
Counting guidelines
No counting guidelines available.
